
Trend Reversal
Trend reversal
Another method of analysis in the area of technical analysis is the trend reversal. To understand what the trend
reversal means it must first be explained what is meant by a trend. You can speak of a trend when the price of an underlying has taken a certain direction. There are short-term as well as medium-
and long-term trends. If the price of a stock e.g. has risen a week in mostly one direction without interruption this can already be called a trend. The chartists work with so-called formations.
A formation is practically a graphical figure in the chart. These formations can be divided into two major groups. Firstly there is the trend confirmation formations and the trend reversal
formations which are primarily interesting for the chartist.
How does a trend reversal formation look like?
A trend reversal pattern always means that an actual trend is "disturbed". A trend reversal marks the end of a trend.
The trend reversal represents a clear trading signal so that an action of the trader is required to either lock in profits or avoid any losses. The most famous formation is the Head-and-Shoulders
formation.
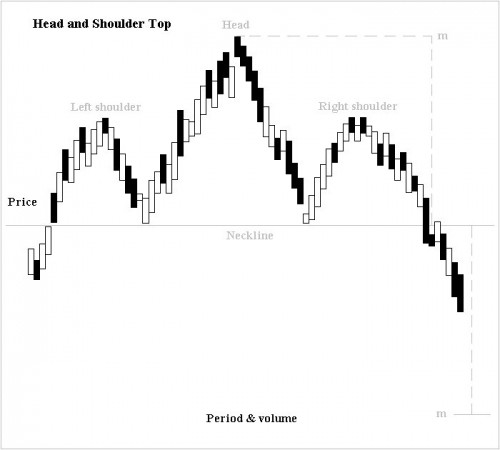
What is the Head-and-Shoulder formation?
The various trend reversal patterns are of course applicable to almost all tradable financial products so on the price
development of stocks, commodities, currencies and indicesand of course in the field of Binary Options. The price of the underlying starts initially examined at the level of the left shoulder.
After that the course runs to the head and increases significantly. Then the price drops almost to the right shoulder so that the exchange rate then coincides approximately with the previous
course which was found on the left shoulder. Within this trend reversal pattern there are different trading signals. From the shoulder of course this formation would have to rise to the head so
that would be a buy signal. From the head it then goes down to the other shoulder so that would be a sell signal.