
Stochastic Oscillator - indicator for MT 5
The Stochastic Oscillator is a technical indicator that compares where a security’s market price closed relative to ist market price range over a given time period.
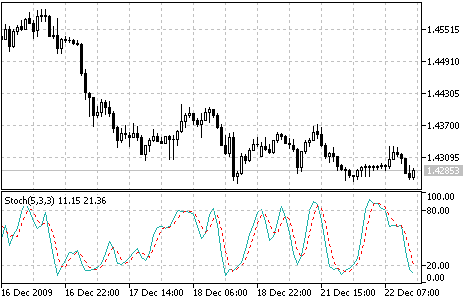
The Stochastic Oscillator is shown as two lines. The main line is called %K and the other line is called %D which is a Moving Average of %K. The %K line is normally shown as a solid line and the %D line is normally shown as a dotted line.
There are different ways to Interpret the Stochastic Oscillator indicator. There exist three popular techniques:
- You buy if the Oscillator (either %K or %D) falls below a specific level (e.g. 20) and then rises above that level. You sell if the Oscillator rises above a specific level (e.g. 80) and then falls below that level;
- You buy if the %K line rises above the %D line and you sell if the %K line falls below the %D line;
- You should look for divergences e.g.: where the market price is making a series of new highs and the Stochastic Oscillator indicator is failing to surpass its previous highs.
Here you can download the Stochastic Oscillator indicator: https://www.mql5.com/en/code/50
In the following video you can learn how to use a Stochastic Oscilator.