
MACD - indicator for MT 5
The MACD indicator is a trend-following dynamic indicator which indicates the correlation between two Moving Averages of a price.
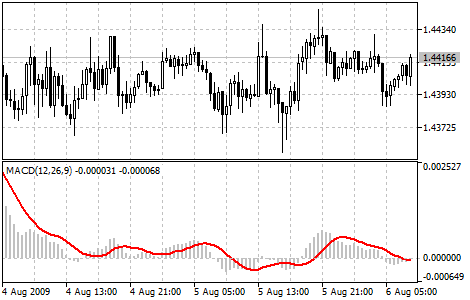
The Moving Average Convergence/Divergence - abbreviated as MACD - Technical Indicator is the difference between a 26-period and 12-period exponential moving averages (EMA). For showing clear opportunities, a so-called signal line (9-period moving average of the indicator) is plotted on the MACD chart.
The MACD is most effective in wide-swinging markets. There exist three popular types for using the Moving Average Convergence/Divergence: crossovers, overbought/oversold conditions and divergences.
- Crossovers: A basic MACD trading rule is to open a put order if the MACD falls below its signal line. A call signal occurs if the Moving Average Convergence/Divergence breaks above its signal line. It is also well known to open a call or put order if the MACD goes above/below zero.
- Overbought/Oversold Conditions: The MACD is also helpful as an overbought or oversold indicator. If the shorter moving average pulls away dramatically from the longer moving average (e.g. the MACD rises), it is probable that the security price is overextending and will soon return to more realistic levels.
- Divergence: An indication that an end to the actual trend may be near occurs if the MACD diverges from the security. A bullish divergence occurs if the Moving Average Convergence/Divergence indicator is making new highs whilst prices fail to reach new highs. A bearish divergence occurs if the MACD is making new lows whilst prices fail to reach new lows. Both of these divergences are most significant if they occur at relatively overbought and oversold Levels.
You can download the MACD indicator here: https://www.mql5.com/en/code/35
In the following video you can learn how to trade with the MACD indicator.